Designing DESIGN Online
We’re working with nutrition education faculty at Teacher’s College on an interactive curriculum builder. The application models the DESIGN Procedure, the brainchild of Professor Isobel Contento with the support of her colleague Associate Research Professor Pam Koch. Students will use this tool to create more effective and engaging nutrition-related learning experiences.
Our Senior Learning Designer Paul Stengel began working with Profs. Contento and Koch several years ago to migrate the DESIGN Procedure from a set of worksheets to Qualtrics, a survey-like environment. Our latest iteration is DESIGN Online, a Django web application using Vue.js as the clientside framework.
This implementation was largely straightforward, building on similar applications that offer a guided learning experience. The DESIGN Procedure is fairly lengthy, so our designer Marc Raymond’s main focus was to provide an intuitive interface with clear wayfinding and progress indicators.

A solid foundation
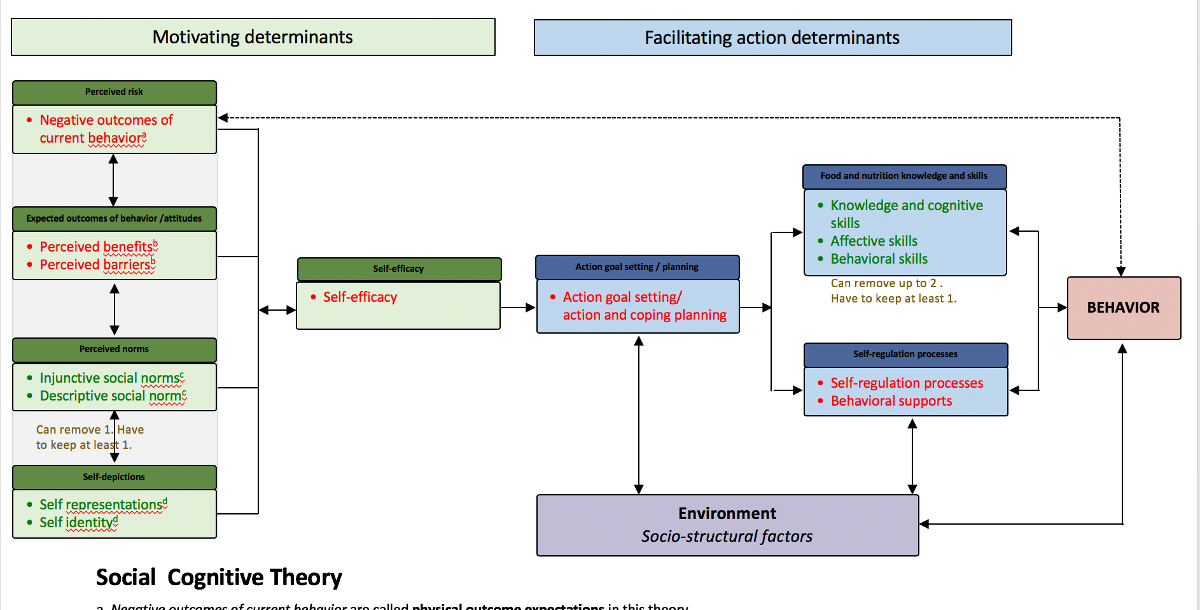
One unique challenge centers around learning theory. In nutrition education, a set of proven theory models guide practitioners and provide a pedagogical structure. These theory models are composed of determinants, identified behaviors and attitudes that cause or impede change. The DESIGN procedure requires students to choose and customize a theory model for each lesson plan, adding and removing determinants where appropriate.
On the faculty’s wishlist was a way to make these theory models come alive. In the paper-based implementation, students customized their theory models with paper and pencil. This approach proved too permissive, resulting in inaccurate models. The ensuing Qualtrics implementation could not technically offer a solution.
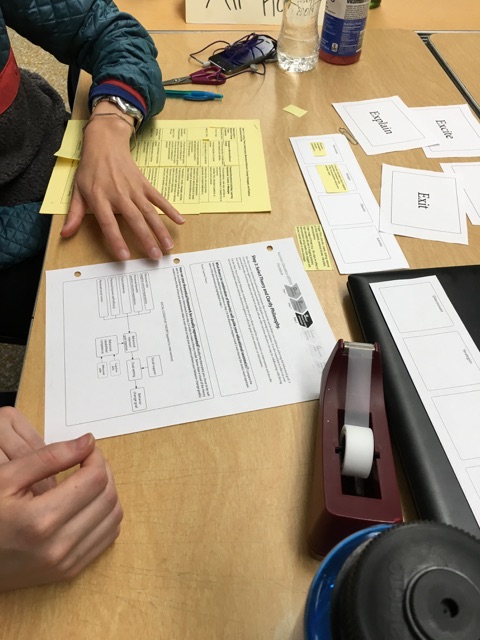
After a lot of talk and white-boarding sessions, our team decided to allow students to interact directly with the models, but only allow some determinants to be added and removed. Each of the five models had “similar but not the same” signatures. These variations led us to draw out detailed documents for each model.
Choosing a library
I surveyed client-based graphing and diagraming libraries, using the selection criteria:
- Open-source, free to use for non-commercial implementations.
- Serialization capabilities.
- Flexible layout control.
- Connectors that dynamically determined their own path.
- User-interface events.
I settled on the open-source JointJS library primarily for its excellent user-interaction capabilities, layout control and its ability to easily connect diagram elements with links. I knew I could come up with a serialization format that worked.
Drawing the diagram
The theory model interactive is implemented within a Vue.js component. The component responds to user-interface events, handles load and save operations and orchestrates the JointJS rendering.
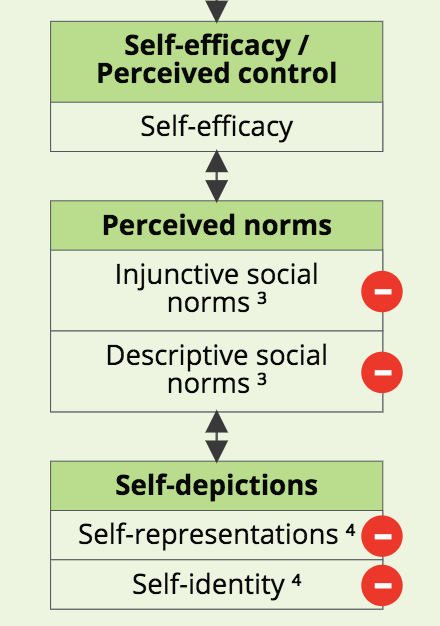
Each model has an initial JSON representation, modeled as a two-dimensional array reflecting a grid layout. Array items describe diagram elements including labels, link relationships and relative offsets from the top y position, and interactivity toggles. Here’s a look at the Perceived Norms category of the Social Cognitive theory. The category contains two determinants that can be removed, and connect to the next category with double arrows.
    {
        "id": 14,
        "label": "Perceived norms",
        "style": "motivator",
        "required": 1,
        "determinants": [
            {"id": 15, "label": "Injunctive social norms ³",
             "show": 1, "interactive": 1},
            {"id": 16, "label": "Descriptive social norms ³",
             "show": 1, "interactive": 1}
        ],
        "links": [{"id": 18, "style": "double", "router": "normal"}]
    },
When the Vue component triggers a render, three passes are made through the JSON structure.
- The first pass calculates the width and height of each element based on its label. Text wrapping is not natively supported in SVG, so I used the JointJS utility joint.util.breakText to break the text into lines based on element width. Width is determined by the current width of the enclosing component divided by the number of columns.
- The second pass creates the JointJS shapes and sets the x, y positions based on the width and height calculations performed in step 3. Interactive shapes also get a delete button.
- The third pass adds the links between the shapes. This operation technically could be accomplished in the second pass. However, rendering happens in the order shapes and connectors are added to the diagram. Adding the connectors last ensures that they are drawn last and can be seen clearly.
The Perceived Norms render looks like so:
Interactivity
The last bit of work was hooking up a click on the JointJS diagram to a “remove determinant” action. JointJS handles this by exposing events on its “paper”. When a shape is clicked, a little work is done to determine if a user clicked on an interactive shape’s delete button. The underlying JSON structure is then updated and saved.
        clickDelete: function(cellView, evt, x, y) {
            if (this.disabled === 'disabled') {
                return;
            }
            if (cellView.$el.hasClass('interactive')) {
                let $elt = cellView.$el.find('.joint-port');
                if ($elt && this.within(evt.clientX, evt.clientY, $elt)) {
                    const did = cellView.$el.data('determinant-id');
                    this.setVisibility(did, 0);
                    this.save();
                }
            }
        },
Pulling it all together
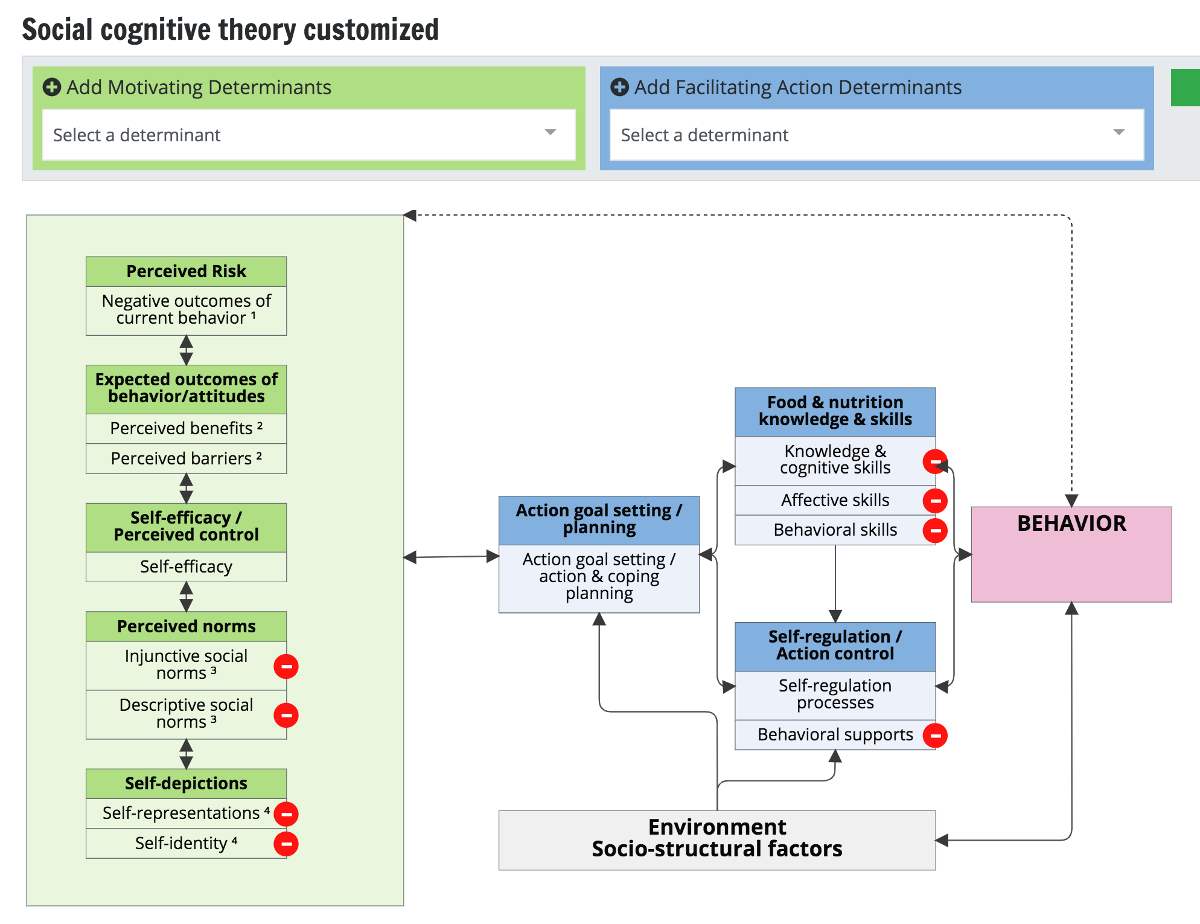
Overall, I’m pleased with this implementation. I like the JSON initialization format, and the final rendering code boils down to just 250 lines of code and is super fast. My only point of frustration is in the exception cases. One of the theory models needs an enclosing container around a set of determinants. Another theory model needs a non-determinant element that spans multiple columns. I handled these as additional attributes within the JSON representation, but the code did start to warp a bit. I do continue to think about ways to handle the rendering even more efficiently.
Note: This repository’s code is private pending licensing agreements. Stay tuned!
Printed from: https://compiled.ctl.columbia.edu/articles/interactive-theory-model/

