Mapping visualizations have been a core component of many of our custom digital learning applications. The geographical interactivity has promoted a significantly richer experience, deepening understanding and encouraging exploration and discovery. My understanding of how to build these applications has improved through collaboration with our clients, the talented faculty and students who form the basis of our audience.
Where to start?
The primary stack that underpins these applications is: Google Maps Javascript API paired with GeoDjango and the PostGis spatial backend. All are well-documented and well-supported. Google Map alternatives include Open Street Map and Leaflet.
Geo-who-what?
Our partners generally want to show something on the map: a location in a forest, a site of teaching and learning, a place where a book was printed. I first walk them through the mechanics of geocoding and reverse geocoding.
Geocoding uses address components to retrieve the latitude and longitude of a location. Reverse geocoding or address lookup provides a description of a given latitude and longitude.
For example:
116th St & Broadway, New York, NY 10027, United States geocodes to 40.8075° N, 73.9626° W.
40.8075° N, 73.9626° W reverse geocodes to
116th St & Broadway, New York, NY 10027, United States
What’s the location?
Obtaining geocodes through geocoding a modern set of well-formed addresses is usually straightforward. A batch process can call the Google API for each address then stash the results. Call the API slowly if you don’t want to incur charges…
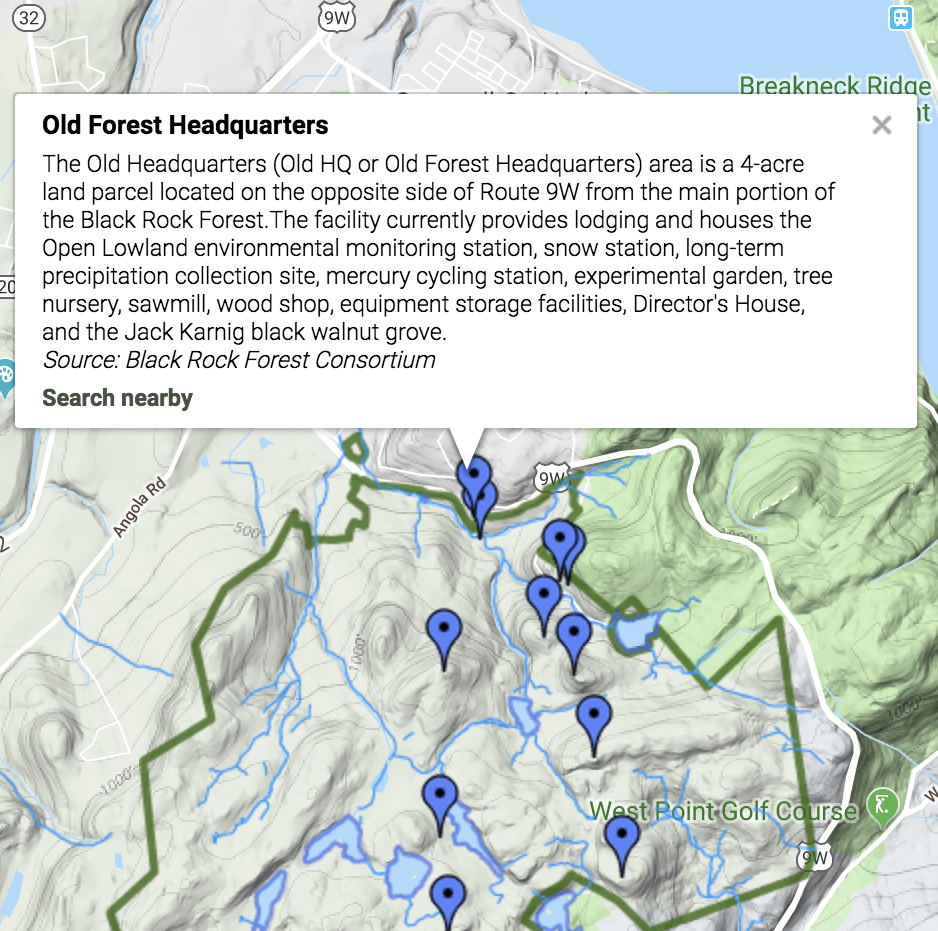
Problems can arise in a few situations. The Virtual Forest Initiative supports research and education at Black Rock Forest. Scientists wanted to visually locate experiments and studies that took place in remote areas without well-formed addresses. Reverse geocoding wasn’t possible here. Instead, locations were geocoded through an admin interface. Editors dropped pins on a map to specify a latitude and longitude. Luckily, the data set was fairly small making this solution workable.
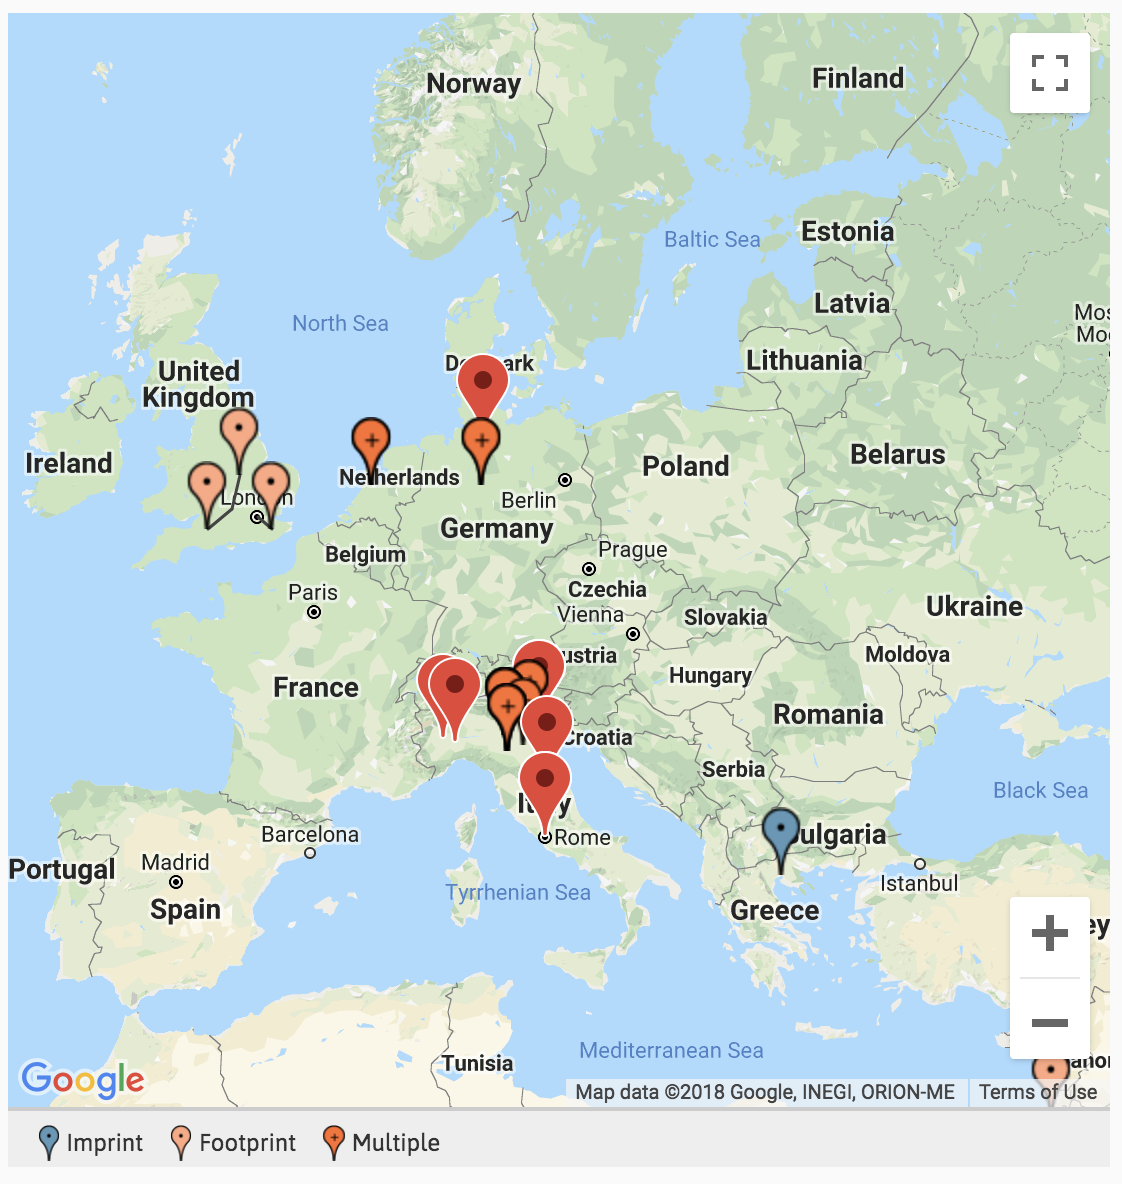
Footprints is an application that traces the path of physical book copies through time and space for the early modern period, roughly between 1500 and 1800. We obviously couldn’t rely on a geocoding service due to historical location descriptions. Initially, we’ve relied on a manual process to geocode the locations. We were then able to optimize this process by drawing in geocoded data from our existing data set.
What’s the address?
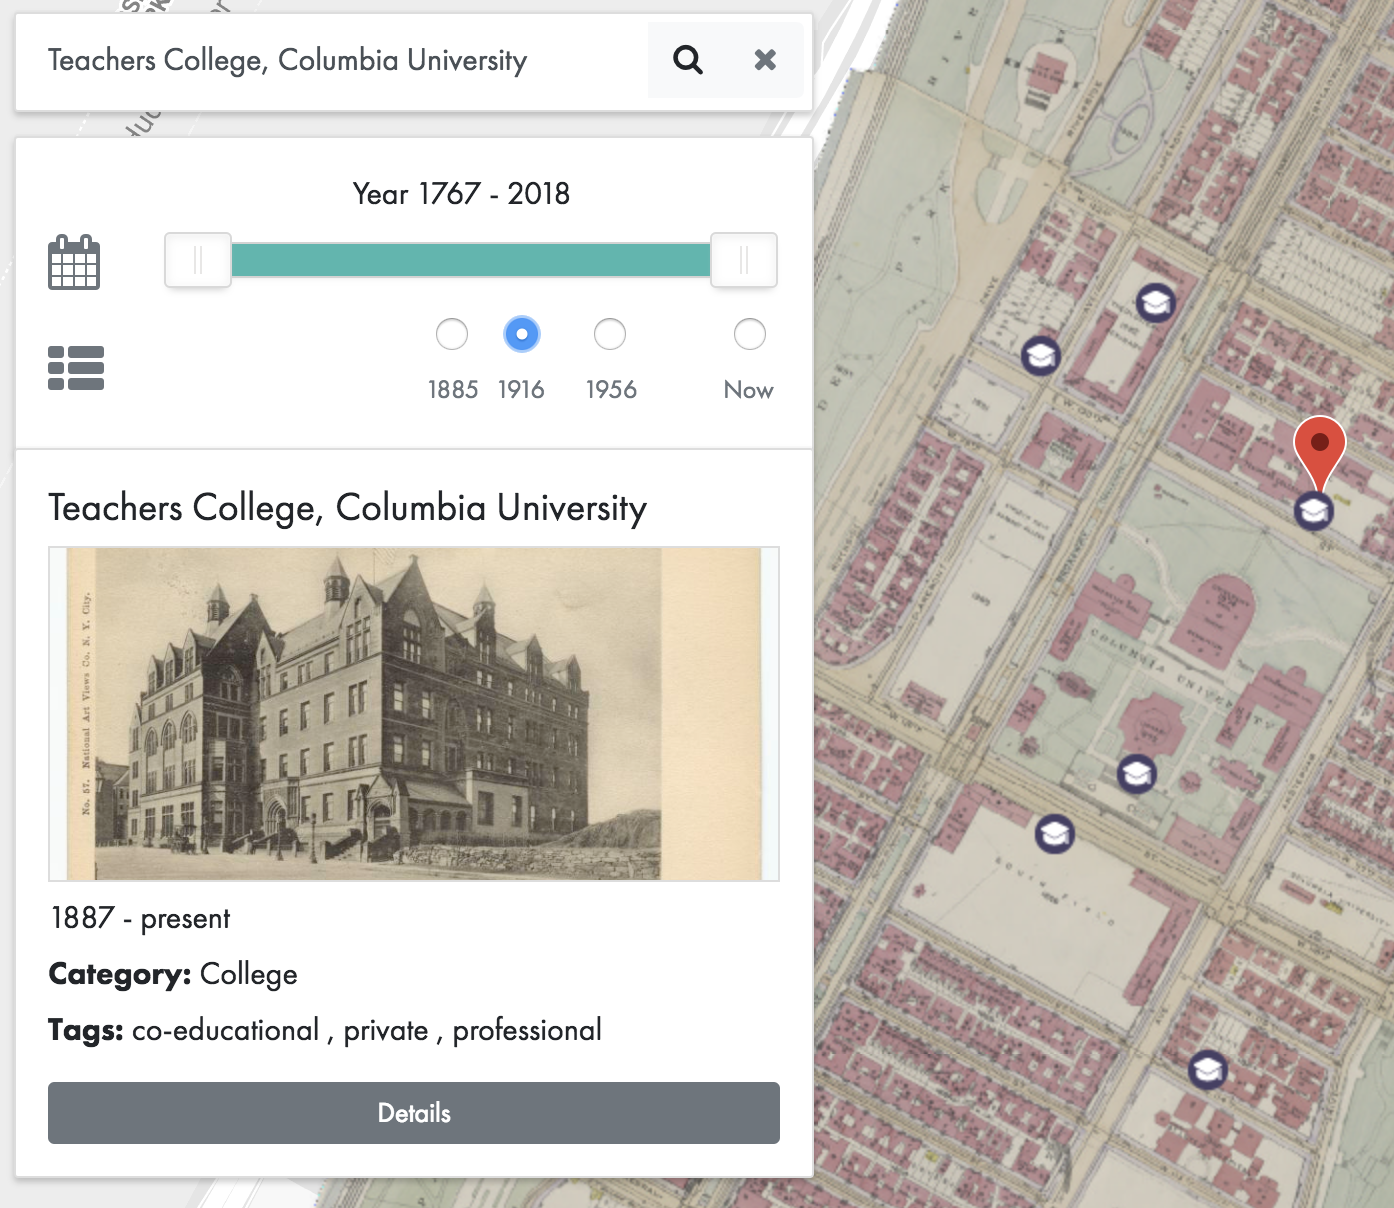
We use reverse geocoding, a.k.a. address lookup, in our applications to allow users to specify an address by dropping a pin on a map. Writ Large NYC is an application that locates sites of teaching and learning in neighborhoods around New York City. An editor drops a pin at a given location, which then automatically kicks off a reverse geocode operation.

The reverse geocoding operation returns an array of addresses, with a
type field
indicating the precision. Precision ranges from street_address to country. An
individual address result is an array of components,
again with a type field
describing the component.
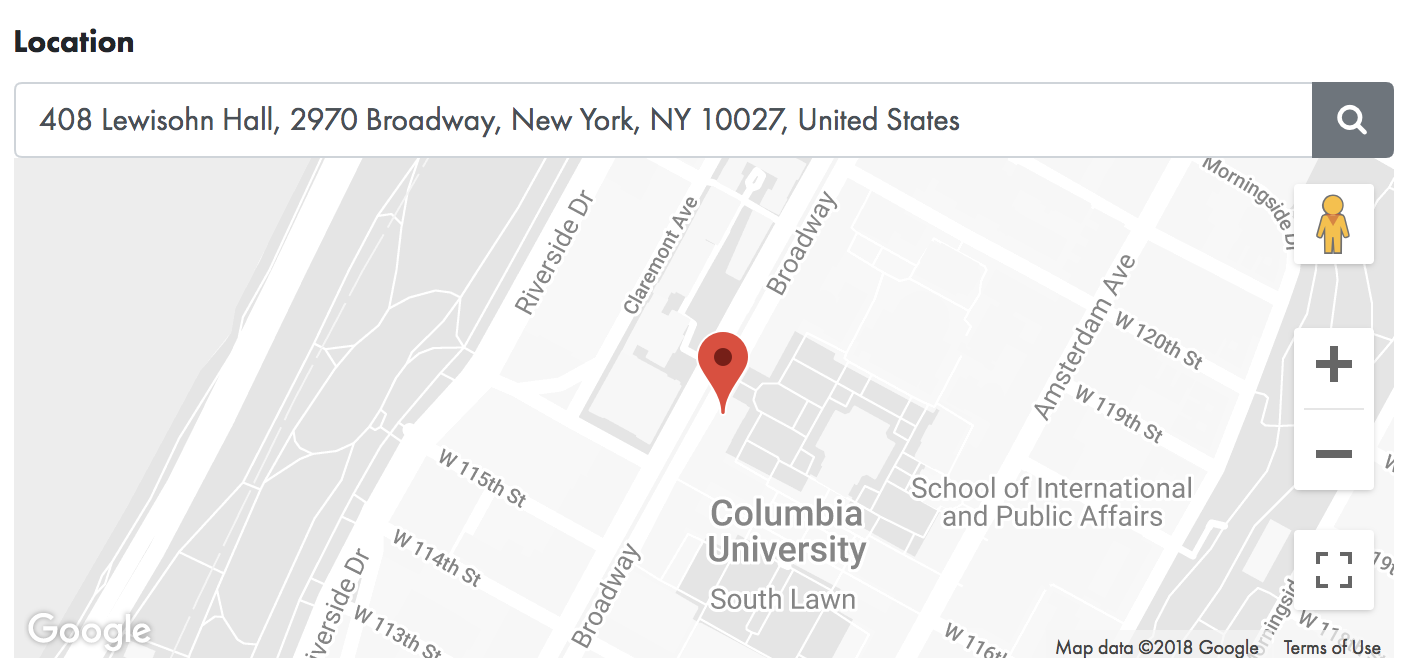
Here’s an example of a reverse geocode result for our office at Lewisohn Hall at Columbia University. This is the list of addresses, highlighting the third address of street_address type.
Array(11)
1: ...
2: ...
3:
    types: ["street_address"]
    formatted_address: "2976 Broadway, New York, NY 10027, USA"
    address_components: Array[8]
        0:
            long_name: "2976"
            short_name: "2976"
            types: ["street_number"]
        1: {long_name: "Broadway", short_name: "Broadway", ...}
        2: {long_name: "Manhattan", short_name: "Manhattan", ...}
        3:
            long_name: "New York"
            short_name: "New York"
            types: (2) ["locality", "political"]
        4: {long_name: "New York County", short_name: "New York County", ...}
        5: {long_name: "New York", short_name: "NY", ...}
        6: {long_name: "United States", short_name: "US", ...}
        7: {long_name: "10027", short_name: "10027", types: ...}
...
Usually the results make sense, but look out
for inconsistencies as you pick and choose your address components. In
Writ Large NYC, I simply use the
street address result type directly. For Footprints,
determining the components that equal city and country took a little
work. I ended up pulling out the locality and country components
from the street address type for display. My first choice, the
locality type did not always exist. But, this can get a little wonky
too. If you drop a pin near Oxford, England, you might end up with England,
United Kingdom. I should probably revisit that behavior.
Display and Interaction
Once the things you want to display are geocoded, the fun begins. Here’s a quick look at each of the display and feature choices we made for our most recent mapping applications.
Virtual Forest Initiative
- Satellite.
- Clickable icons with popup info windows.
- KML overlays with points of interest.
- “Search Nearby” feature that takes advantage of the GeoDjango backend distance lookups.

Footprints (GitHubrepo)
- Roadmap.
- Clickable icons with popup info windows.
- Overlapping Marker Spiderfier to handle situations where many data points where at the same latitude and longitude.

Writ Large NYC
- Styled map using Snazzy Maps.
- Map overlays from New York Public Library’s Map Warper tool.
- Clickable icons with overlay info windows.
- Custom icons.

Big Ideas
We are continuing to iterate on our mapping applications and have some big ideas on where to go next. One big idea that we haven’t realized yet for both Footprints and Writ Large NYC is the ability to “play” our locations over time. It is something like what TimeMapper does but with a greater focus on the map rather than the accompanying details.
Code
Printed from: https://compiled.ctl.columbia.edu/articles/making-the-map/

