At the CTL, we use Graphite and Grafana to monitor all of our server infrastructure, but our last physical server, a QNAP file server, does not have a straightforward way to send its metrics to a graphite monitoring environment. Even worse, it runs a customized version of Linux which we were hesitant to modify. Luckily it does support the Simple Network Management Protocol (SNMP), which can do just that.
What is SNMP?
It is a network protocol for collecting information about managed devices. Traditionally it is used by many types of networking equipment, including switches, routers, etc. It’s paired with a MIB file (Management Information Base file), which is a collection of information organized hierarchically. SNMP uses the MIB files to know which information to poll, as it has definitions of the properties of the managed object of the device. The objects identifiers, or OID, uniquely identify objects within the MIB hiearchy, and is the data we actually need to collect.
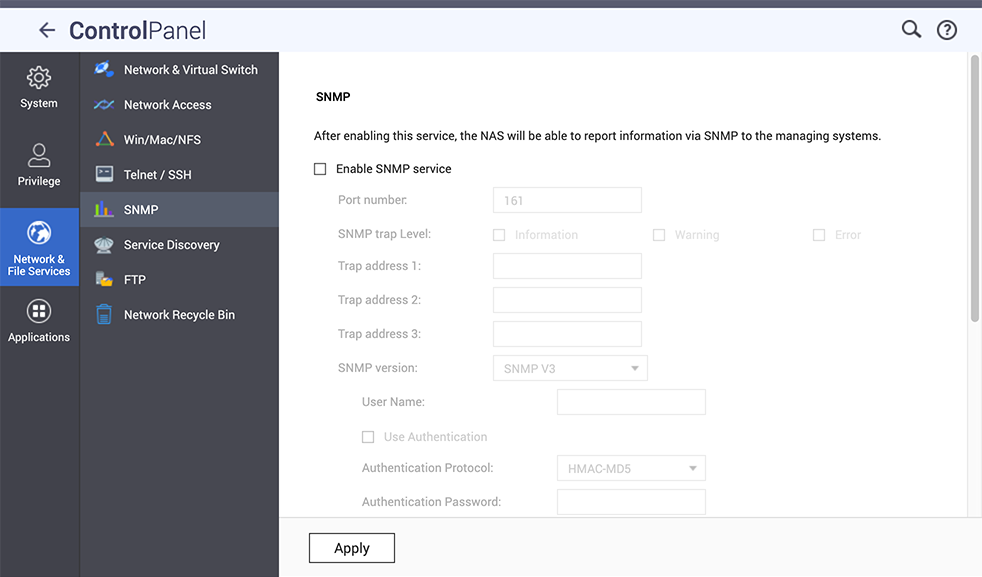
The first step is to enable SNMP on the QNAP server, which was can be enabled from the QNAP QTS Web interface under Control Panel > Network & File Services > SNMP. Once enabled, the option appears to download the MIB file.

What Metrics Can We Collect?
Once SNMP is enabled on the device, we must install the net-snmp suite of tools on our monitoring server. One of them is called snmpwalk, which polls the SNMP device for available information.
apt-get install snmp
We then have to add the MIB file to the snmp watch directory, which by default
is either $HOME/.snmp/mibs or /usr/local/share/snmp/mibs. Running the
command net-snmp-config --default-mibdirs will also give you the MIB
directory location.
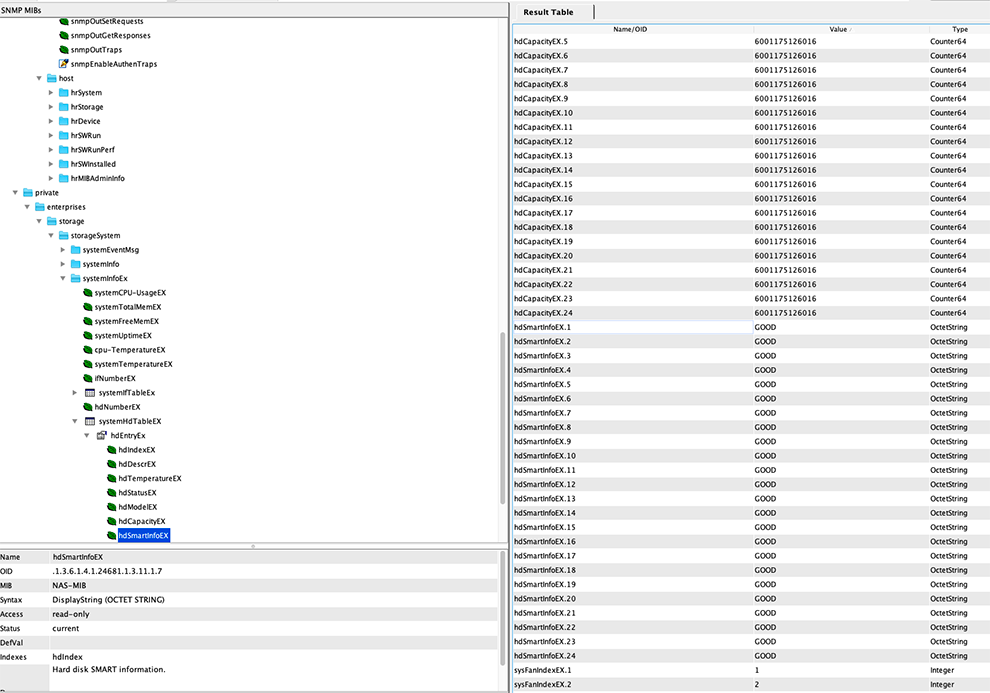
Console output from this tool is very hard to read, so I used one of the many available MIB browsers to see which data can be polled. There are many out there, but they all use the manufacturer MIB file to identify the OID’s of information that can be collected. You load the MIB file, specify the destination, and it will issue a snmpwalk command to retrieve information from the device which can be explored with the GUI:

Collecting the Metrics
Collectd is an excellent daemon for collecting performance metrics and has tons of plugins, including one for SNMP, which can poll the device for specified metrics and a Write Graphite plugin which can then feed it into our Graphite server.
Install collectd:
apt-get install collectd
Modify the configuration file at /etc/collectd/collectd.conf. The default config file has lots of options, which are mostly disabled and commented out. I won’t focus on the global configuration, but there are a few variables to be set like hostname, logging options, plugin directory, etc.
We’ll be enabling the SNMP and write_graphite plugins. The SNMP manual page of collectd has detailed information about how to configure the plugins, but each metric has to be specified individually. For example, to get the CPU usage:
<Plugin snmp>
        <Data "qnap_cpu_usage_core">
                Type "cpu"
                Table true
                InstancePrefix "core"
                Instance "NAS-MIB::cpuIndex"
                Values "NAS-MIB::cpuUsage"
        </Data>
The SNMP plugin also has to have the host details specified, along with the data you wish to collect and the interval.
        <Host "HOST">
                Address "IP_ADDRESS"
                Version 2
                Community COMMUNITY
                Collect "qnap_cpu_usage_core"
                Interval 360
        </Host>
Finally, we configure the write_graphite plugin:
<Plugin write_graphite>
        <Node "GRAPHITE_NODE_HERE">
                Host "GRAPHITE_SERVER_IP"
                Port "2003"
                Protocol "tcp"
                LogSendErrors true
                Prefix "qnap."
                Postfix ""
                StoreRates true
                AlwaysAppendDS false
                EscapeCharacter "_"
        </Node>
</Plugin>
And start the daemon:
sudo service collectd start
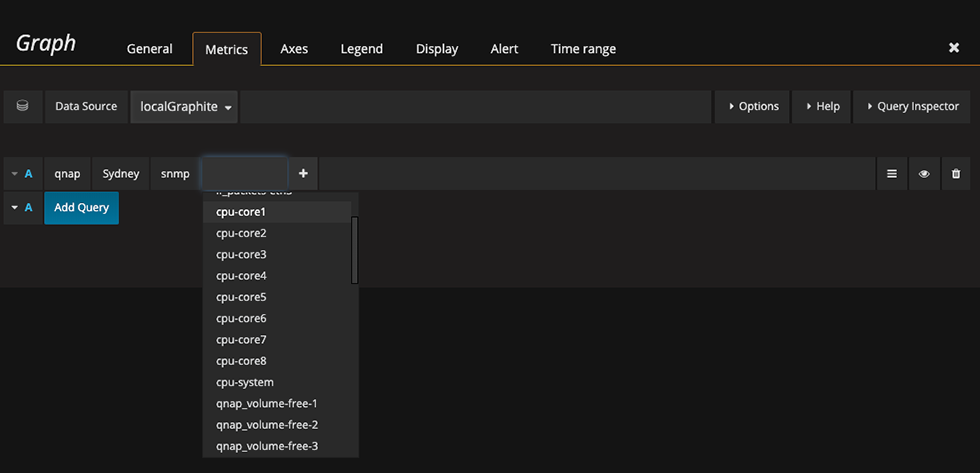
Once the daemon has been started, you should see a new data source within graphite. Below is an example using Grafana, which we use as our Graphite frontend:

Once the data source is added, you can build out your dashboard, and add Alerts.
Printed from: https://compiled.ctl.columbia.edu/articles/qnap-monitoring-environment/

