A hallmark of DevOps is the constant search for more secure methods to protect infrastructure, a process known as hardening. In Part 1, we detailed how we moved away from managing SSH keys and whitelisting IP’s to leveraging AWS Systems Manager (SSM) Session Manager to securely connect to our EC2 instances.
Another important change we made was to integrate CloudWatch and CloudTrail so that we could set up alerting for crucial infrastructure changes. AWS has a great high level overview of how the process works:

— Source: AWS Security Blog
CloudTrail is an AWS service enabled on account creation that logs API activity and records details such as who initiated a change, what was done, when it was done, and where the change was applied to.
CloudWatch is an AWS Service that collects monitoring and operational data from logs, metrics, and events, and allows for visualization and notifications to be sent when specified patterns are detected.
Configuring CloudTrail
CloudTrail is especially useful since all AWS activity is recorded as API calls, and it can be easily integrated into other AWS services. For auditing purposes, we set up a single trail to log all management events in all regions, however multiple trails can be created for data events or other metrics. CloudTrail evaluates desired event matches, and delivers those events to an S3 bucket and a CloudWatch log group. Amazon has put out a great tutorial on getting started with CloudTrail. Once the trail is created, the Management events section of the trail in the CloudTrail console should reflect that all API activity is logged:

Once the trail has been configured, CloudWatch must be enabled and configured.
Configuring CloudWatch
A log group must be created for matching trail events to be sent to. This can be done from the CloudTrail console by clicking the trail, and choosing Configure under the CloudWatch Logs section.
An IAM role must also be created for CloudTrail to assume in order to send log events to CloudWatch
Logs. We used the
AWS managed IAM role
CloudTrail_CloudWatchLogs_Role with policy text:
{
  "Version": "2012-10-17",
  "Statement": [
    {

      "Sid": "AWSCloudTrailCreateLogStream2014110",
      "Effect": "Allow",
      "Action": [
        "logs:CreateLogStream"
      ],
      "Resource": [
        "arn:aws:logs:us-east-2:accountID:log-group:log_group_name:log-stream:CloudTrail_log_stream_name_prefix*"
      ]

    },
    {
      "Sid": "AWSCloudTrailPutLogEvents20141101",
      "Effect": "Allow",
      "Action": [
        "logs:PutLogEvents"
      ],
      "Resource": [
        "arn:aws:logs:us-east-2:accountID:log-group:log_group_name:log-stream:CloudTrail_log_stream_name_prefix*"
      ]
    }
  ]
}
Verify that management events from CloudTrail are being fed into our new log group in CloudWatch.
Creating CloudWatch Metric Filters
To determine its state and when an alarm should be triggered, Metric Filters are used. A metric filter scans the CloudWatch logs and filters them based on specified criteria. CloudWatch logs can then be associated with metrics for alarms. For example, a metric filter could count the number of root logins, the number of security group changes, the number of IAM policy changes, etc. Based on the filter evaluation, an alarm will execute a predefined action, in our case an SNS notification to the sysadmin team.
In the CloudWatch console, click logs, and then log groups to see the newly created CloudTrail log group.
To create a metric filter, click actions, then create metric filter.
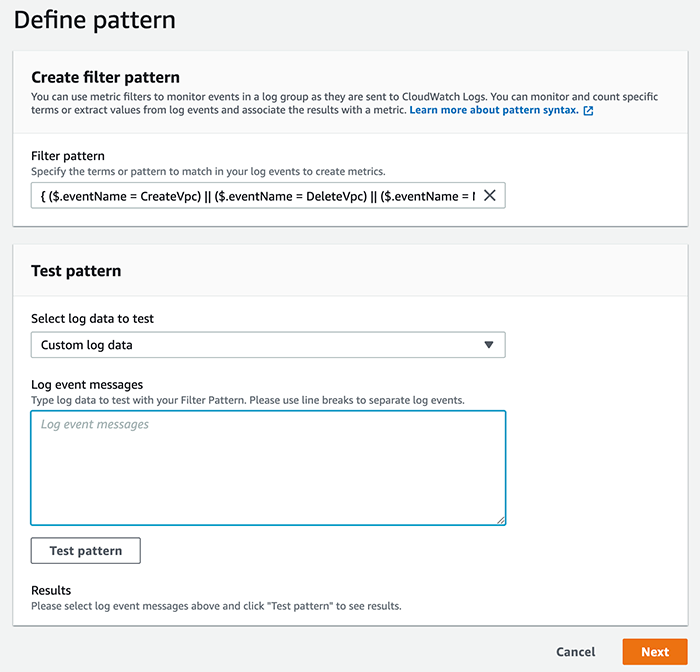
The first option is filter pattern, the term or expression that we want to match against. There’s also a convenient way to test the filter pattern before creating the metric filter.
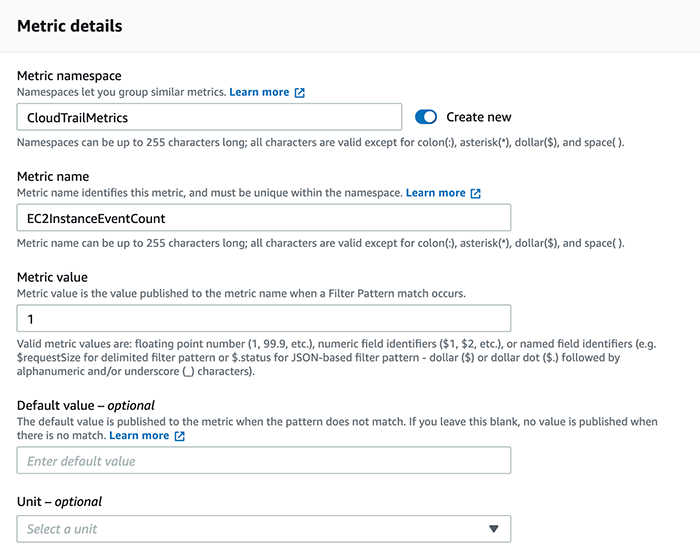
Next, options are given for the metric details. The metric is the numerical representation of the filter’s data. It can be named with metric name, can be grouped with similar metrics in a metric namespace, and most importantly, the filter requires a value to be published as the metric value when the filter is matched. For our needs, this will be 1 since we want to count the occurrences of logs matching the patterns:
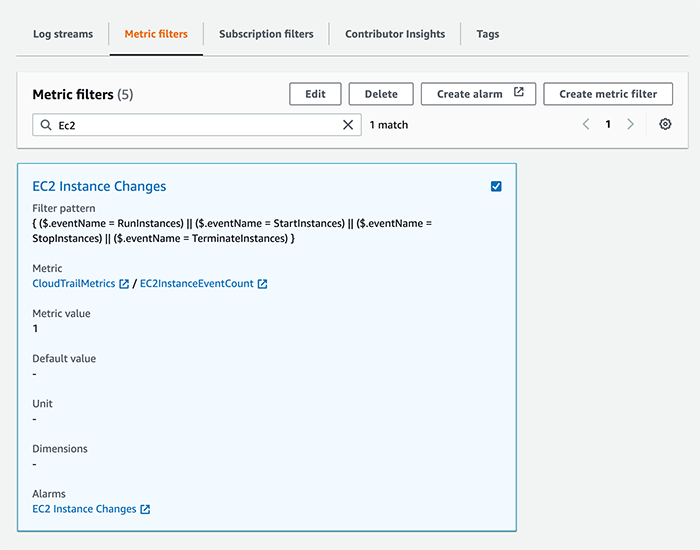
Below are some of the filter patterns that we’ve setup metric filters for:
Filter Pattern for monitoring Root Account Usage:
{ $.userIdentity.type = "Root" && $.userIdentity.invokedBy NOT EXISTS && $.eventType != "AwsServiceEvent" }
Filter pattern for EC2 instance changes:
{ ($.eventName = RunInstances) || ($.eventName = StartInstances) || ($.eventName = StopInstances) || ($.eventName = TerminateInstances) }
Filter pattern for IAM Policy Changes
{($.eventName=DeleteGroupPolicy)||($.eventName=DeleteRolePolicy)||($.eventName=DeleteUserPolicy)||($.eventName=PutGroupPolicy)||($.eventName=PutRolePolicy)||($.eventName=PutUserPolicy)||($.eventName=CreatePolicy)||($.eventName=DeletePolicy)||($.eventName=CreatePolicyVersion)||($.eventName=DeletePolicyVersion)||($.eventName=AttachRolePolicy)||($.eventName=DetachRolePolicy)||($.eventName=AttachUserPolicy)||($.eventName=DetachUserPolicy)||($.eventName=AttachGroupPolicy)||($.eventName=DetachGroupPolicy)||($.eventName=CreateUser)||($.eventName=DeleteUser)||($.eventName=AddUserToGroup)||($.eventName=UpdateGroup)||($.eventName=UpdateUser)}
Filter pattern for Security Group Changes
{ ($.eventName = AuthorizeSecurityGroupIngress) || ($.eventName = AuthorizeSecurityGroupEgress) || ($.eventName = RevokeSecurityGroupIngress) || ($.eventName = RevokeSecurityGroupEgress) || ($.eventName = CreateSecurityGroup) || ($.eventName = DeleteSecurityGroup) }
Filter Pattern for VPC changes
{ ($.eventName = CreateVpc) || ($.eventName = DeleteVpc) || ($.eventName = ModifyVpcAttribute) || ($.eventName = AcceptVpcPeeringConnection) || ($.eventName = CreateVpcPeeringConnection) || ($.eventName = DeleteVpcPeeringConnection) || ($.eventName = RejectVpcPeeringConnection) || ($.eventName = AttachClassicLinkVpc) || ($.eventName = DetachClassicLinkVpc) || ($.eventName = DisableVpcClassicLink) || ($.eventName = EnableVpcClassicLink) }
Creating CloudWatch Alarms
Once a Metric Filter has been created, you can create alarms by selecting the Metric Filter and clicking Create Alarm:
Give the Alarm a name, and choose the Metric Namespace that was created earlier:
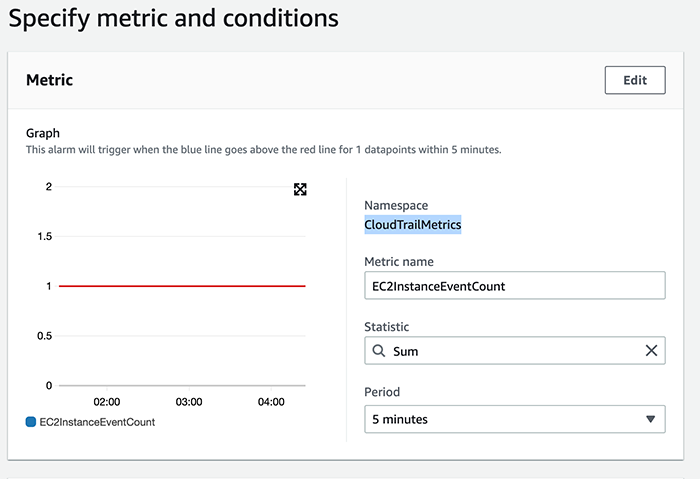
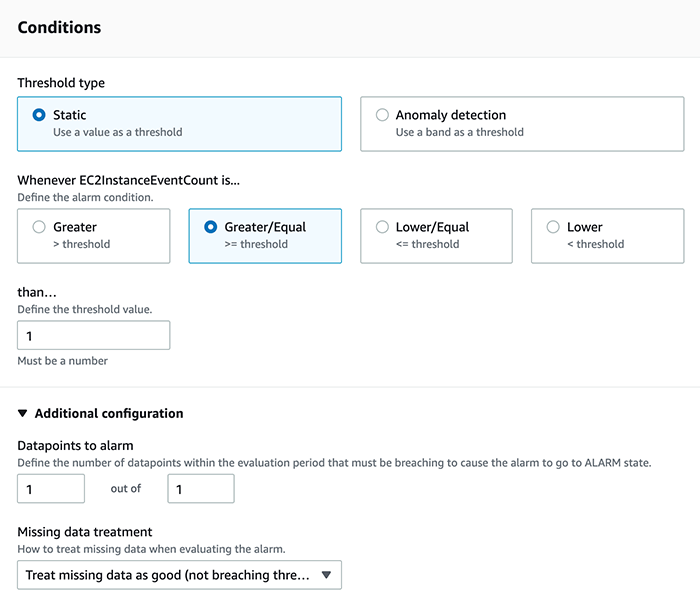
The alarm will have to have a threshold, a statistic, and a comparison to determine when the metric should receive a data point. In this case, the alarm is triggered when the sum of the logs is greater than or equal to the threshold one. Important: Under ‘Additional Configuration’, it’s important to set the ‘data points to alarm’ field as it defines the number of metric data points that must match to sound an alarm. In this example, the alarm is triggered for each datapoint that breaches our conditions:
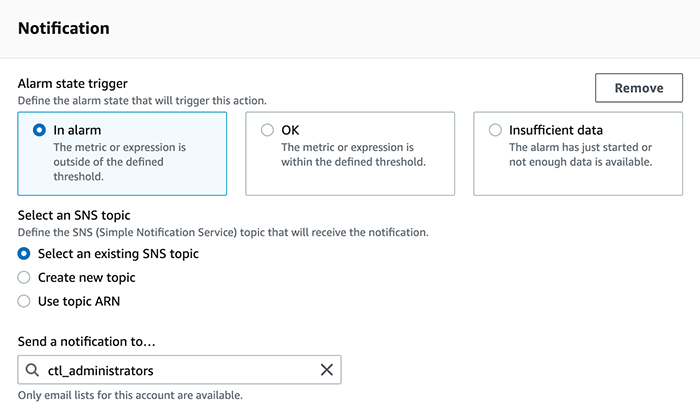
The final step in creating an alarm is to specify the Actions. In our case, we will be using a predefined SNS topic which sends an email to the system administrators when the alarm state is reached:
This configuration allows for extremely robust monitoring, and CloudWatch alarms can be created with auto scaling or systems manager actions for even more flexibility. It’s also important to note that this configuration is not designed for real time alerting, and AWS specifically states that “CloudTrail typically delivers logs within an average of about 15 minutes of an API call. This time is not guaranteed. Review the AWS CloudTrail Service Level Agreement for more information.” Nevertheless, it is an effective tool to monitor critical pieces of AWS infrastructure that are changed infrequently.
Printed from: https://compiled.ctl.columbia.edu/articles/secure-aws-infrastructure-2/

